Date |
Activities |
Due |
| 1/13 |
|
|
| 1/13 |
Go to this site and choose the best days and times for you to attend SI meetings. |
1/15 |
| 1/13-15 |
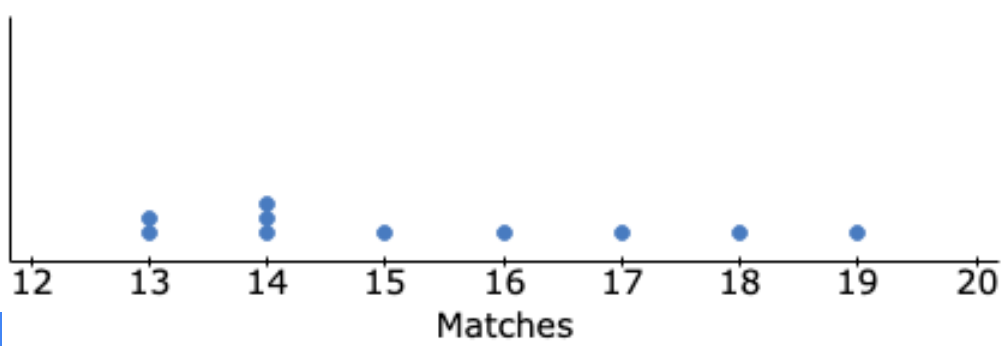
- Complete book pages 3-8. You will need this dotplot to answer questions 10-14.
- e-mail me a link ot your favorite cereal commercial.
|
1/17 |
| 1/15 |
|
1/17 |
| 1/17 |
Lab (8-8119)
- Go to this site and set the spinner to 3 areas. Then run ten trials and record the proportion of blue spins. Think of blue as a "match" from our activity in class.
- Reset the spinner for 21 trials (this is like 21 other people spinning at the same time. Do this ten times, each time recording your results and noting any extreme values.
- Now set the spinner to 3,000 trials. Repeat this three or four times. What do you notice about the difference between the actual and the theoretical probabilities for 3,000 trials compared with 43 trials?
- Record your results a Google Doc (or word file) or in the body of an e-mail and send it to me. Include your observations about whether or not you think this offers convincing evidence that our class results for zodiac matches were proof of the zodiac's accuracy.
- Go to this site and set the number of flips to 21. Click the "No" button for cumulative results and select Table. Then flip the coins and record the numver of heads. Repeat this ten times. Then enter your results here.
|
1/17 |
| 1/17 |
Extra Credit: Register for this course (It's free); you will work on it over the next two weeks. Begin the course by watching the introductory video. When you complete the course you will be issued a pdf certificate of completion. Please send a copy of this certificate to me by 2/8. |
2/8 |
| 1/17 |
- Read and Complete book pages 15-16
- Complete the OLI reading for Module 4 and OLI Checkpoint (Module 4)
- Complete Mod 4 Notes
|
1/22 |
| 1/22 |
|
1/24 |
| 1/24 |
Lab:
- Follow up to competent face discussion. View this slide and choose the 2020 presidential candidate you think looks most competent. Then go to this site and enter your choice.
- Explore this site. Comment on three things you find there. Include snips of graphs that you use.
- Explore this site (notice there are over 200 pages to choose from). Choose three links to follow and discuss what you find. Include snips of graphs that you use.
- Register with StatCrunch;
- Follow this link to study a data set on police reports from Pittsburgh, PA. Got to the Graph menu and choose dotplot. In the dotplot window choose Age and press Compute. Open a GoogleDoc and describe the shape of the reulting distribution. Comment on what you think is the typical age of a person arrrested by the Pittsburgh police. Snip a picture of the dotplot and insert it in your GoogleDoc.
- Now go to the Data menu and select Sample in order to take a random sample of the Age and Gender of those arrested. Choose Age and Gender (use Shift) and make the sample size 200.
- Then make pie charts (from the Graph menu) of Gender from the population and Sample Gender (use Control key to select both and change graph display for rows to 2). Compare the two - how much are they alike?
- Now make a dotplot for Age and Sample Age. Select the mean and median options and again compare the results.
- Send me a link to your GoogleDoc.
|
1/27 |
| 1/24 |
|
1/27 |
| 1/27 |
- Complete book pages 24-25; 27-29; 31-32
- Complete book pages 39-42
|
1/29 |
| 1/29 |
- Read OLI Unit 2, Module 6 (please attempt each activity).
- Complete Mod 6 notes
- Complete checkpoint 1 and 2 for OLI Unit 2, Module 6
- Complete book pages 77-79 (in class) - here are class results (pg 78-9)
|
1/31 |
| 1/31 |
- Enter your car data here
- Write up the results of the study described below: Perform random sample of Skyline cars. Our question is what are the proportions of car colors at Skyline? Execute this sample by doing a cluster sample to choose a parking lot (select one lot randomly among the 7 parking lots at Skyline). Once you arrive at your selected lot perform a systematic sample to choose 20 cars: Estimate the number of cars in the lot, divide that number by 20 and generate two random numbers between 1 and the resulting value. e,g, if there are about 200 cars in the lot then you would choose two random numbers between 1 and 10. Once you have sampled 20 cars for their color , calculate the proportion of each color car in your sample. Write to me for class data if you missed class.
- Write a brief summary of your car data collection. Include a description of which lot you went to; how you sampled the cars ther (give details including the numbers you used); describe your impression of the procedure - was it easy/difficult, would you do it differently . . ..
- Complete Book pages 45-49; 50 - 54
|
2/3 |
| 1/31 |
LAB:
|
2/3 |
| 2/3 |
- Complete book pg 34 - 37 (in class jigsaw)
- Complete pages 69 - 75 (experimental design)
- Any old assignments (chp 1) you would like to have excused (because you didn't turn them in) must be completed and discussed with me by 2/6. Please put your notes in order and identify any outstanding questions you would like to have answered.
|
2/5 |
| 2/5 |
- Complete book pages 64-67 (in class)
- Watch this video and write a brief summary with your reflections on whether it holds value for you and how this might influence your life.
- Read OLI Unit 3, Module 7. Be sure to attempt the interactive questions and use them as a guide in completing Mod 7 notes.
|
2/7 |
| 2/7 |
- Read OLI Unit 3, Module 7
- Read pg 84 and Complete Book pages 85-86
- Begin Mod 7 Notes
- Watch this video and write a brief summary with your reflections on whether it holds value for you and how this might influence your life.
|
2/10 |
| 2/7 |
LAB:
- Open this file to complete the activity from OLI on 5 Number Summary (OLI pg 42). Send images of the summary stats and boxplot to me in an e-mail or GoogleDoc.
|
2/10 |
| 2/10 |
Breakfast Cereal Assignment and Data |
|
| 2/10 |
|
2/12 |
| 2/12 |
|
2/19 |
| 2/19 |
- Open this file to complete the activity from OLI on 5 Number Summary (OLI pg 42). Send images of the summary stats and boxplot to me in an e-mail or GoogleDoc.
- Complete Book pages 100-108
- Take and complete OLI Mod 8 checkpoint
- Complete Boxplots Page from class
|
2/21 |
| 2/21 |
LAB:
- Use the Rossman and Chance Descriptive Statistics applet to help you develop a sense of how skew affects measures of center.
- Open StatCrunch, search for and join the group Math 190 S20. Make Boxplots for the data set on Age and Height and compare the results.
- Complete the OLI LBD on pg 34 (actor ages) and enter your comments
|
2/22 |
| 2/21 |
|
2/24 |
| 2/24 |
- Go to this form and enter your initials and the circumference of the ball you measured in class.
- Complete Mean Mean activity pg 1-4 (from class)
- Complete book pages 116-118
- Complete Matching exercise (in class)
- Complete reading/doing OLI Mod 9 activities
- Complete OLI Mod 9 Checkpoint
- Complete Mod 9 Notes
|
2/26 |
| 2/26 |
- Complete reading and activities for OLI Mod 10
- Complete Mod 10 Notes
- Complete Mod 10 Checkpoint 1
|
2/28 |
| 2/28 |
Lab
- Open this file containing a national sample of heights (in cm) from over 9500 participants. Make a dotplot of the variable BMXHT and perform a SOCS analysis on the data. Comment on why you think the data are shaped the way they are.
- Which measure of center d oyou expect to be larger, the mean or the median? Why? Edit the dotplot to show the mean and median to check your answer.
- Now go to the Stats menu and select Summary Statistics. Choose the BMXHT variable and record the median, IQR, mean and standard deviation. Use the standrd deviation to define the interval around the mean where a mojortity of the data are collected.
- Now go to the Graph menu and select Boxplot. Make a boxplot for the same variable - be sure to select the Graph Horizontally checkbox. Position the boxplot directly over the dotplot and take screenshot of the two together. Comment on what the quartiles on the boxplot tell you about the distribution of heights.
- Open the Pittsburgh data set, make a dotplot of Age and guess which will be larger, the median or the mean. Check your answer by chooseing edit and selecting mean and median markers.
- Open a New Data Table in StatCrunch (StatCrunch menu) and enter ten different two digit numbers under Var1. Make a second list by adding 100 to each of the values in Var1. Make a third list by multiplying each of the values in Var1 by 1.1 (this is equivalent ot adding 10%). Compare the results using mean and SD.
|
3/2 |
| 2/28 |
- Complete Mean/Median H/O
- Use this data set to complete Standard Deviation LBD on OLI pg 48
- Complete Mod 10 Checkpoint 2
- Complete Mod 10 Notes
- Prepare for Unit 3 exam covering book chapter 2 (pg 83 - 130)
|
3/2 |
| 3/2 |
- Complete pg 126-127, and pg 129
- Use StatCrunch with pg 126-129. Find the Temps data set in the Math 190 S20 group.
- Prepare for Unit 3 exam covering book chapter 2 (pg 83 - 130)
|
3/4 |
| 3/9 |
- Read and do activities in OLI Mod 11
- Read and do book pages 133-138
- Complete Mod 11 Notes (using OLI!)
- Take OLI Mod 11 Checkpoint
|
3/11 |
| 3/11 |
- Go to this page and enter your leg length and steps data
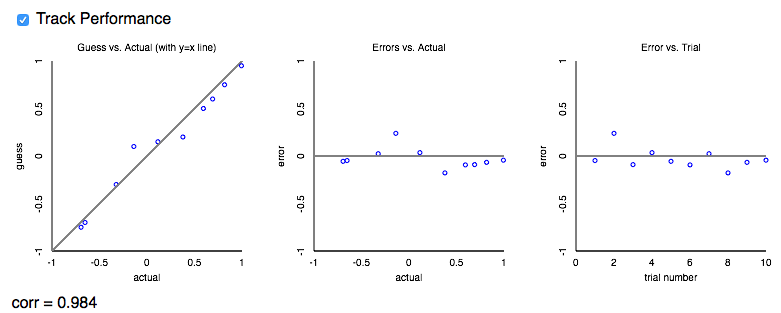
- Go to the Rossman & Chance Correlation Guessing Game and click the Track Performance box. Then play the game ten times.
- Take a screen shot of your performance (example) and send it to me
- Use the cereal data to determine which variables have the strongest correlation with the Consumer Reports ratings. Send me your top three choices with pictures and a brief explanation supporting your choices. Include one example of very weak correlation with CR rating.
- Complete book pages 133-138. Read page 139
|
3/13 |
| 3/13 |
Lab
- Go to the Rossman & Chance Correlation Guessing Game and click the Track Performance box. Then play the game ten times.
- Take a screen shot of your performance (example) and send it to me
- Use the cereal data to determine which variables have the strongest correlation with the Consumer Reports ratings. Send me your top three choices with pictures and a brief explanation supporting your choices. Include one example of very weak correlation with CR rating.
|
3/16 |

