|
|||||||
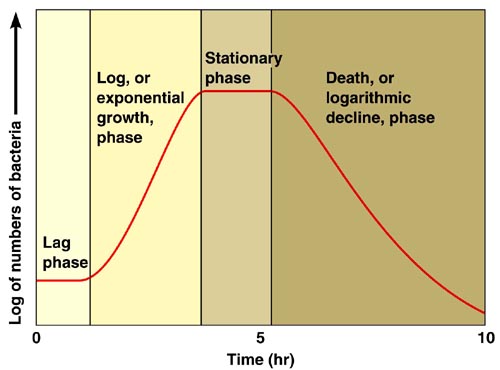
During log phase, the cells are growing at the fastest rate possible under the conditions provided. Generation or doubling time is the time it takes for one cell to divide into two cells—or the time required for the population of cells to double. The shorter the generation time, the faster the growth. The growth of a bacterial population can be determined by inoculating a growth medium with a few cells and counting the cells over time. However, bacteria in suspension in a broth scatter light and cause the transparent broth to appear turbid. This turbidity can be measured with a spectrophotometer to determine bacterial growth. Although turbidity is not a direct measure of bacterial numbers, increasing turbidity does indicate growth. Changes in the logarithmic absorbance scale on the spectrophotometer correspond to changes in the number of cells. Consequently, a growth curve can be obtained by graphing absorbance (Y-axis) vs. time (X-axis). The rate of growth is indicated by the slope of the lines; faster growth produces a steeper (higher-number) slope Procedure 2. Aseptically inoculate a flask of nutrient broth with 10 ml of bacteria. 3. Swirl to mix the contents. Transfer 2-4 ml from the flask to the second spectrophotometer tube. Wipe the surface of the spectrophotometer tube with a low lint, nonabrasive paper such as a Kimwipe. Place the tube in the spectrophotometer, wait about 45 sec, and measure the absorbance (Abs.) on the spectrophotometer. 4. Record all measurements. 5. Incubate the flask at the appropriate temperature. (Water baths provide the most consistent temperature.) 6. Record the absorbance every 30 minutes for 24-48 hours. Remove the flask from the water bath for the minimum time possible to take each sample. To take a sample, aseptically pipette 2-4 ml into the second spectrophotometer tube. 7. Graph the data you obtained. 8. Determine the generation time. Select two points, (a) and (b), in the log phase during which the absorbance doubled and determine the number of minutes required for the culture to go from (a) to (b). Sample Excel file. |


 Background